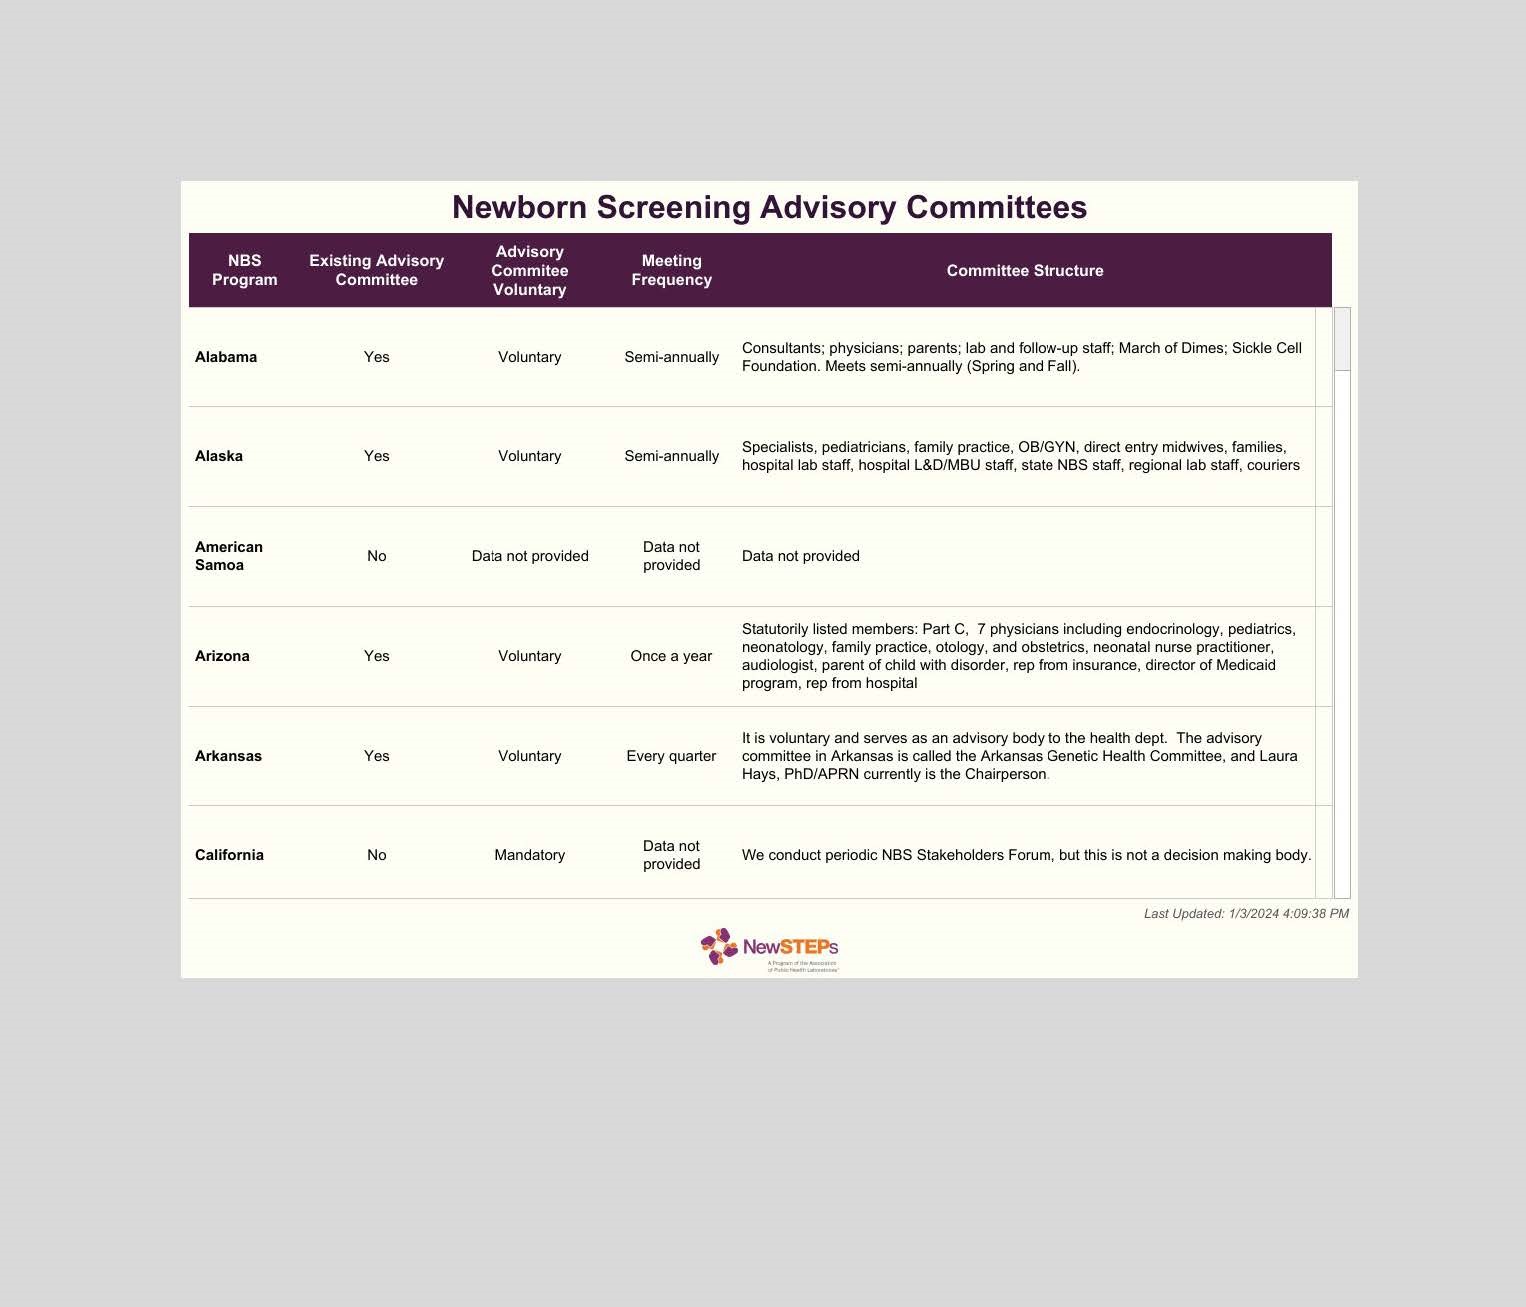
Dashboards and Reports
The interactive dashboards and reports utilize data entered into the NewSTEPs Repository. These reports and queries are updated each evening. Access to the Tableau dashboards is now integrated with your NewSTEPs user account. The single sign-on feature means that users only need to log into NewSTEPS.org, and permission to view the quality indicator and case dashboards is now based on your NewSTEPs user role. Please contact newsteps@aphl.org if you are interested in obtaining an infographic user account or if you have any questions or suggestions concerning any current or future data dashboards.
